Multiple Choice
Which figure below is the correct graph of the linear equation x = 3?
A) 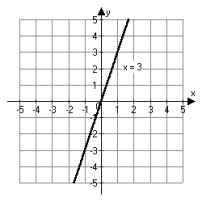
B) 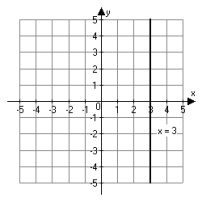
C) 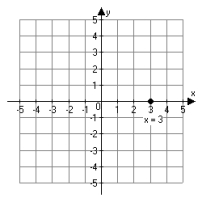
D) 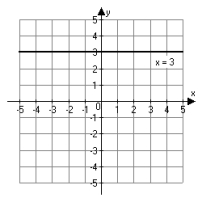
Correct Answer:

Verified
Correct Answer:
Verified
Related Questions
Q1: The budget deficit for the city of
Q2: Line l goes through (3, 2) and
Q4: If s varies inversely as x and
Q5: Write a formula that expresses the relationship
Q6: Gotham City's budget deficit was $6.2 million
Q7: Find the slope and the y-intercept of
Q8: Line l goes throught the point (5,-2)
Q9: Which figure below is the correct graph
Q10: Find the slope of the line that
Q11: Complete the ordered pair so that it