Multiple Choice
Which of the following graphs illustrates the behavior of a total fixed cost within the specified relevant range?
A) Graph 2
B) Graph 3
C) Graph 4
D) Graph 1 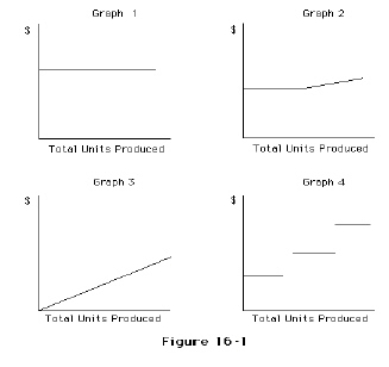
Correct Answer:

Verified
Correct Answer:
Verified
Related Questions
Q7: Snower Corporation sells product G for $150
Q12: If the contribution margin ratio for Harrison
Q28: A change in fixed costs as a
Q37: If a business sells two products, it
Q52: Kennedy Co. sells two products, Arks and
Q54: Variable costs are costs that vary on
Q57: If fixed costs are $350,000,the unit selling
Q57: If direct materials cost per unit decreases,
Q84: If fixed costs are $850,000 and the
Q89: Variable costs as a percentage of sales