Multiple Choice
Which of the following graphs illustrates the nature of a mixed cost?
A) Graph 2
B) Graph 3
C) Graph 4
D) Graph 1 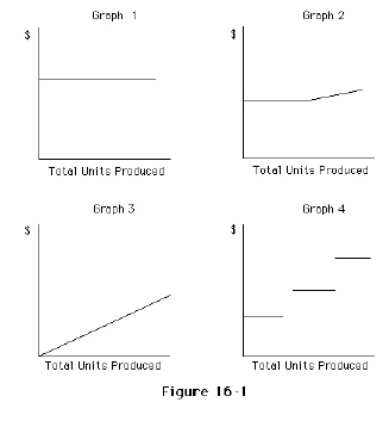
Correct Answer:

Verified
Correct Answer:
Verified
Related Questions
Q9: With the aid of computer software, managers
Q23: Total fixed costs remain constant as the
Q23: Which of the following is an example
Q52: If fixed costs are $250,000,the unit selling
Q60: If a business had sales of $4,000,000
Q65: Variable costs are costs that vary in
Q77: If variable costs per unit increased because
Q96: Monthly rent on a factory building is
Q103: Rouney Co.has budgeted that factory supervisors' salary
Q129: DeGiaimo Co.has an operating leverage of 5.If