Multiple Choice
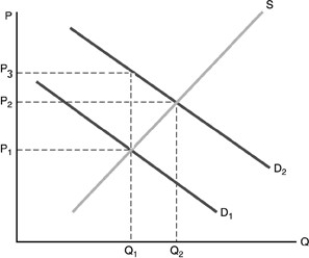
-Refer to the above figure.The market equilibrium quantity is .Point
Represents the optimal amount of production.The government can achieve the optimal outcome by
A) setting the price at .
B) providing a per-unit subsidy to consumers equal to -
.
C) providing a per-unit subsidy to consumers equal to -
.
D) establishing a tax equal to -
per unit of the good sold.
Correct Answer:

Verified
Correct Answer:
Verified
Q66: In the United States, which of the
Q98: Why does our government enforce antitrust legislation?<br>A)
Q110: When a good causes positive external benefits
Q162: <img src="https://d2lvgg3v3hfg70.cloudfront.net/TB2893/.jpg" alt=" -Refer
Q212: What are the three goals of the
Q224: The amount of government spending on education
Q248: <img src="https://d2lvgg3v3hfg70.cloudfront.net/TB5018/.jpg" alt=" -A firm that
Q262: Government can correct for negative externalities by<br>A)
Q309: All of the following are characteristics of
Q355: As a share of total national income,