Multiple Choice
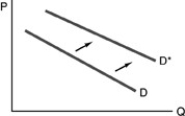
-Refer to the above figure. The arrows show the direction of a shift in the demand curve of Good A. Which of the following would be the most likely reason for the shift in the demand curve if Good A is an inferior good?
A) An increase in the price of Good A
B) A decrease in the price of Good A
C) A decrease in consumers' income
D) An increase in consumers' income
Correct Answer:

Verified
Correct Answer:
Verified
Q55: A demand curve is a<br>A) graphical representation
Q73: An improvement in technology in the production
Q92: If an increase in the incomes of
Q100: A demand schedule<br>A) holds all prices constant.<br>B)
Q123: <img src="https://d2lvgg3v3hfg70.cloudfront.net/TB5016/.jpg" alt=" -Refer to the
Q180: Other things being equal, an increase in
Q223: The Chunnel auto tunnel allows motorists to
Q381: Suppose we observe that the demand for
Q430: <img src="https://d2lvgg3v3hfg70.cloudfront.net/TB5018/.jpg" alt=" -Refer to the
Q446: Which of the following will shift today's