Multiple Choice
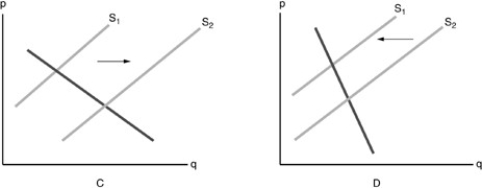
-Refer to the above figure. Which diagram shows the effect on the market of Corn Flakes when the demand for Corn Flakes has increased?
A) graph C
B) graph D
C) neither graph
D) both graphs
Correct Answer:

Verified
Correct Answer:
Verified
Related Questions
Q129: Which of the following does NOT cause
Q151: When producers anticipate that the price of
Q180: An increase in the price of input
Q245: The relationship between quantity supplied and the
Q284: The law of demand includes the statement
Q365: Which of the following is an example
Q421: <img src="https://d2lvgg3v3hfg70.cloudfront.net/TB5016/.jpg" alt=" -In a free
Q422: Suppose that today, consumers expect the price
Q425: <img src="https://d2lvgg3v3hfg70.cloudfront.net/TB5016/.jpg" alt=" -If the market
Q426: The price of bread in terms of