Multiple Choice
Which of the following statements with respect to the figure below is INCORRECT? 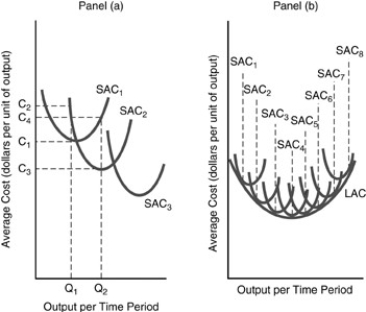
A) All the possible short-run average cost curves that correspond to the different plant sizes are shown as -
.
B) If the anticipated permanent rate of output per unit time period is in panel (a) ,the optimal plant would correspond to
.
C) If the permanent rate of output increases to in panel (a) ,it will be more profitable to have a plant size corresponding to
.
D) The long-run average cost curve LAC in panel (b) is sometimes called the planning curve representing the locus (path) of points.
Correct Answer:

Verified
Correct Answer:
Verified
Q19: <img src="https://d2lvgg3v3hfg70.cloudfront.net/TB5018/.jpg" alt=" -In the above
Q22: <img src="https://d2lvgg3v3hfg70.cloudfront.net/TB5018/.jpg" alt=" -Refer to the
Q40: <img src="https://d2lvgg3v3hfg70.cloudfront.net/TB5013/.jpg" alt=" -Refer to the
Q72: <img src="https://d2lvgg3v3hfg70.cloudfront.net/TB5013/.jpg" alt=" -Using the above
Q112: Suppose that when the level of output
Q118: The average product of labor is equal
Q174: What are the relationships between the marginal
Q177: A decrease in the long-run average costs
Q257: The production function<br>A) gives the maximum amount
Q313: Explain how you can calculate average physical