Multiple Choice
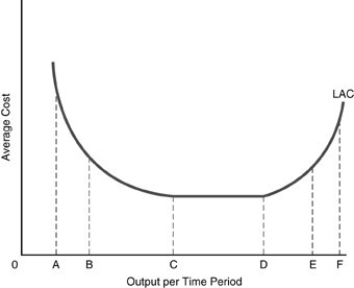
-In the above figure, the long-run cost curve between points A and B illustrates
A) diseconomies of scale.
B) diminishing marginal product.
C) constant returns to scale.
D) economies of scale.
Correct Answer:

Verified
Correct Answer:
Verified
Q111: <img src="https://d2lvgg3v3hfg70.cloudfront.net/TB5018/.jpg" alt=" -Refer to the
Q112: Which equation is used by a manager
Q113: <img src="https://d2lvgg3v3hfg70.cloudfront.net/TB5018/.jpg" alt=" -Refer to the
Q114: The law of diminishing marginal product is
Q115: <img src="https://d2lvgg3v3hfg70.cloudfront.net/TB5018/.jpg" alt=" -According to the
Q117: The marginal cost curve intersects<br>A) the average
Q118: The average product of labor is equal
Q119: <img src="https://d2lvgg3v3hfg70.cloudfront.net/TB5018/.jpg" alt=" -In the above
Q120: Marginal product and average product are measured
Q121: When output is 100 units, the firm's