Multiple Choice
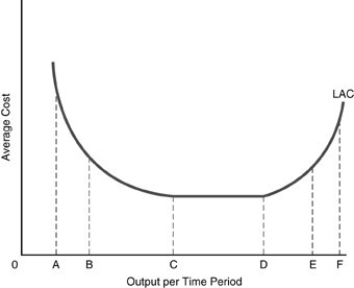
-In the above figure, the long-run cost curve between points C and D illustrates
A) diseconomies of scale.
B) diminishing marginal product.
C) constant returns to scale.
D) economies of scale.
Correct Answer:

Verified
Correct Answer:
Verified
Q353: Average total cost equals<br>A) TC/Q.<br>B) TVC/Q.<br>C) TFC/Q.<br>D)
Q354: Production<br>A) is a process by which resources
Q355: <img src="https://d2lvgg3v3hfg70.cloudfront.net/TB5018/.jpg" alt=" -In the above
Q356: In economics, the short run means a
Q357: The law of diminishing marginal product states
Q359: The planning horizon is the<br>A) long run.<br>B)
Q360: <img src="https://d2lvgg3v3hfg70.cloudfront.net/TB5018/.jpg" alt=" -In the above
Q361: Fixed costs include all but<br>A) a normal
Q362: <img src="https://d2lvgg3v3hfg70.cloudfront.net/TB5018/.jpg" alt=" -If, in the
Q363: If in the short run total product