Multiple Choice
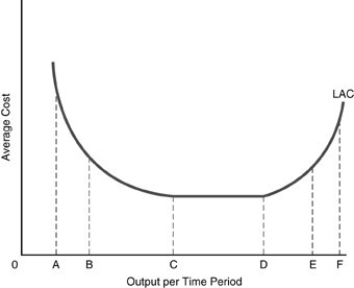
-In the above figure, the long-run cost curve between points E and F illustrates
A) diseconomies of scale.
B) diminishing marginal product.
C) constant returns to scale.
D) economies of scale.
Correct Answer:

Verified
Correct Answer:
Verified
Q270: Assume it takes 10 units of labor
Q271: <img src="https://d2lvgg3v3hfg70.cloudfront.net/TB5018/.jpg" alt=" -In the above
Q272: Suppose that a firm is currently producing
Q273: <img src="https://d2lvgg3v3hfg70.cloudfront.net/TB5018/.jpg" alt=" -Refer to the
Q274: A basic distinction between the long run
Q276: Average fixed costs will<br>A) rise as output
Q277: The relationship Q = f(K, L) is
Q278: Assume that in the short run a
Q279: <img src="https://d2lvgg3v3hfg70.cloudfront.net/TB5018/.jpg" alt=" -The distance between
Q280: <img src="https://d2lvgg3v3hfg70.cloudfront.net/TB5018/.jpg" alt=" -Refer to the