Multiple Choice
The minimum efficient scale in the figure below shows that 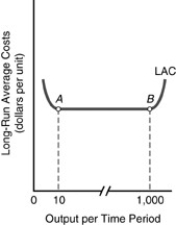
A) point A is the minimum efficient scale (MES) for the firm.
B) point B is the minimum efficient scale (MES) for the firm.
C) the long-run average cost curve (LAC) reaches a minimum point at B.
D) the minimum efficient scale (MES) illustrates maximum average costs.
Correct Answer:

Verified
Correct Answer:
Verified
Q28: <img src="https://d2lvgg3v3hfg70.cloudfront.net/TB5018/.jpg" alt=" -In the above
Q47: If Microsoft is determining whether to build
Q171: Every point on the long-run average cost
Q178: When total product is decreasing, marginal product
Q216: <img src="https://d2lvgg3v3hfg70.cloudfront.net/TB2893/.jpg" alt=" -Refer
Q310: A firm's long-run average cost curve is<br>A)
Q336: Marginal cost is equal to<br>A) change in
Q343: <img src="https://d2lvgg3v3hfg70.cloudfront.net/TB5018/.jpg" alt=" -Using the above
Q347: <img src="https://d2lvgg3v3hfg70.cloudfront.net/TB5018/.jpg" alt=" -MC = AVC
Q376: The long run is defined as a