Multiple Choice
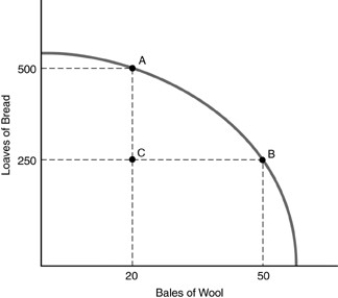
-Refer to the above figure. Which one of the following statements is true with regard to the economy depicted in the graph?
A) Point C cannot be produced.
B) The best production point is 500 loaves of bread and 50 bales of wool.
C) The total amount of resources it takes to produce 20 bales of wool and 500 loaves of bread is more than the amount of resources needed to produce 50 bales of wool and 250 loaves of bread.
D) The total amount of resources it takes to produce 20 bales of wool and 500 loaves of bread is the same as the amount of resources needed to produce 50 bales of wool and 250 loaves of bread.
Correct Answer:

Verified
Correct Answer:
Verified
Q23: <img src="https://d2lvgg3v3hfg70.cloudfront.net/TB5013/.jpg" alt=" -Refer to the
Q29: Bonnie is a self employed. She makes
Q30: What happens to the production possibilities curve
Q34: When a country specializes and trades with
Q58: When a country or a region of
Q69: If opportunity costs are constant, then<br>A) the
Q79: Which of the following is NOT an
Q178: You have the option of consuming one
Q344: Generally, specialization leads to<br>A)constant opportunity costs.<br>B)greater productivity.<br>C)the
Q350: Explain how comparative advantage, specialization and division