Multiple Choice
Refer to the table below. 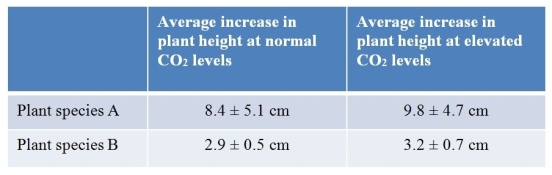 A biologist studied plant growth using two plant species grown over a 2-week period.For each species, 20 plants were used, randomly split into control and experimental groups.Except for CO2 exposure, conditions were identical for all plants.The table summarizes results as average height increase, along with a plus/minus value indicating the range of individual plant heights measured.Which is the null hypothesis that would be developed when using statistics to analyze these results?
A) The growth rates of certain species of plants are more influenced by CO2 levels than others.
B) Differences in growth rate at the different CO2 levels could be due to random variations in the samples of both species.
C) All plants show variation in growth rate when environmental variables are changed.
D) Carbon dioxide is one of many variables that can influence plant growth rate.
E) The effect of CO2 on plant growth rate depends on the species of plant being investigated.
Correct Answer:

Verified
Correct Answer:
Verified
Q106: Which of the following is not a
Q107: Refer to the table below. <img src="https://d2lvgg3v3hfg70.cloudfront.net/TB5650/.jpg"
Q108: Refer to the figure below. <img src="https://d2lvgg3v3hfg70.cloudfront.net/TB5650/.jpg"
Q109: If samples were brought back from a
Q110: Why is it important in science to
Q112: Which statement about aerobic metabolism is false?<br>A)
Q113: The use of energy from sunlight to
Q114: A species consists of<br>A) all the populations
Q115: A researcher collected frog and water samples
Q116: According to current thinking about the rise