Multiple Choice
Which figure correctly depicts the size ranges of both prokaryotic and eukaryotic cells? Note that the scales are logarithmic and not linear.
A) 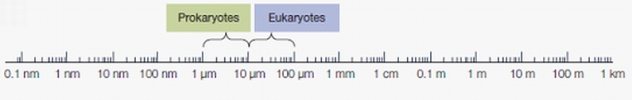
B) 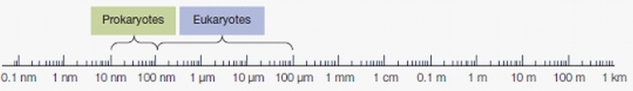
C) 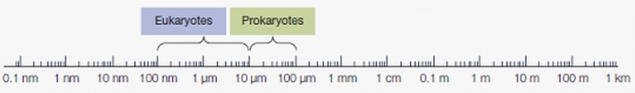
D) 
E) 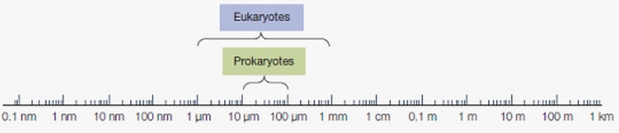
Correct Answer:

Verified
Correct Answer:
Verified
Related Questions
Q189: Scientists have been able to culture human
Q190: Refer to the figure below. <img src="https://d2lvgg3v3hfg70.cloudfront.net/TB5650/.jpg"
Q191: How does the surface area-to-volume ratio of
Q192: Five statements are given that describe cells.Which
Q193: Prokaryotic cells<br>A) do not share a common
Q195: Researchers observe that while the actin microfilaments
Q196: Refer to the table below summarizing the
Q197: To visualize subcellular structures such as chloroplasts,
Q198: The cytosol and _ are two components
Q199: Refer to the figure below showing tubular