Multiple Choice
Refer to the figure and table below. 
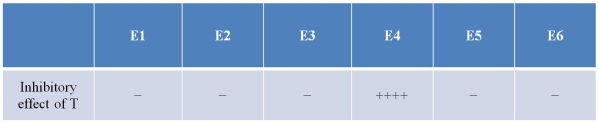 The figure shows a metabolic pathway catalyzed by a series of enzymes labeled with numbers.The metabolite T was tested for inhibitory effects on each enzyme in the pathway, and the results are summarized in the table.The extent of inhibition is indicated by the number of plus signs.Lack of inhibition is indicated by a minus sign.Which statement gives a valid conclusion from these results?
A) The production of T is not regulated by feedback inhibition.
B) The inhibitory mechanism of T involves reversible phosphorylation.
C) T is a competitive inhibitor of E4.
D) The step from X to Y is the first commitment step in the production of T.
E) The step from Q to R is the first commitment step in the production of T.
Correct Answer:

Verified
Correct Answer:
Verified
Q41: Computer-based models aimed at simulating the different
Q42: Refer to the figure below. <img src="https://d2lvgg3v3hfg70.cloudfront.net/TB5650/.jpg"
Q43: Which statement about allosteric regulators is true?<br>A)
Q44: Which statement about enzymes is true?<br>A) They
Q45: Chemical equilibrium<br>A) is a static state where
Q47: Refer to the figure below. <img src="https://d2lvgg3v3hfg70.cloudfront.net/TB5650/.jpg"
Q48: Refer to the expression below. <img src="https://d2lvgg3v3hfg70.cloudfront.net/TB5650/.jpg"
Q49: The process that involves an end product
Q50: In cells, multiple biochemical pathways are all
Q51: Refer to the figure below. <img src="https://d2lvgg3v3hfg70.cloudfront.net/TB5650/.jpg"