Essay
Refer to the graph and table below. 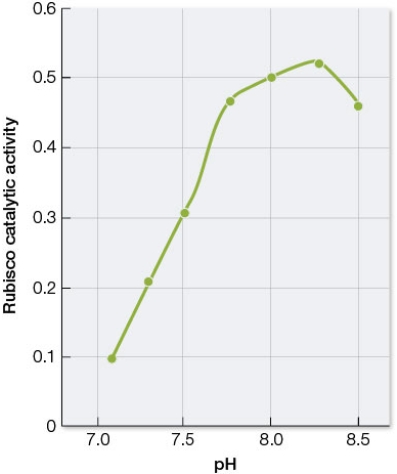
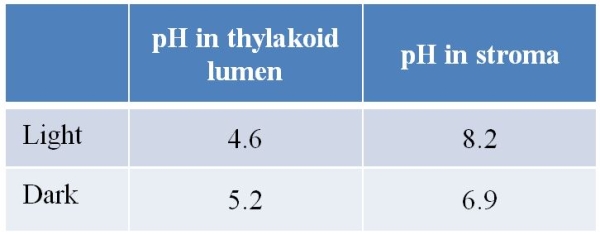 The graph was produced from data obtained by measuring the rate of the reaction catalyzed by the enzyme rubisco under different pH conditions.The data in the table were obtained by measuring the pH inside the thylakoid lumen and in the stroma of a chloroplast under conditions of light and dark.Based on these data, what do you predict will happen to rubisco inside living plant cells when a plant that has been kept in the dark for several hours is moved into a brightly lit room? Explain your reasoning, and also explain the biological mechanism that underlies these observations.
Correct Answer:

Verified
Correct Answer:
Verified
Q1: Rubisco is the most abundant protein on
Q2: Both the light reactions and the light-independent
Q4: Which enzyme catalyzes the first step in
Q5: Which substance has not been identified as
Q6: How many moles of CO<sub>2</sub> must enter
Q7: Accessory pigments<br>A) play no specific role in
Q8: Refer to the figure below. <img src="https://d2lvgg3v3hfg70.cloudfront.net/TB5650/.jpg"
Q9: During photophosphorylation, free energy is released<br>A) by
Q10: Chlorophyll a is<br>A) a pigment found in
Q11: Carotenoids and phycobilins absorb photons between the