Essay
Refer to the figure showing the steps used in microarray analysis to detect differences in expression between tumor tissue and normal tissue.The spots in the bottom panel represent individual genes for patients who have good prognoses (left) as well as for patients who have poor ones (right).The colors of those spots represent levels of expression: red = high expression, yellow = intermediate expression, green = low expression. 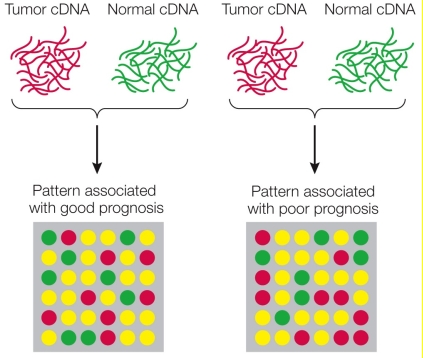 Look at the lowest, left-most gene in both patterns.Does expression of this gene correlate with the prognoses? Explain your answer.
Correct Answer:

Verified
No, it does not correlate with...View Answer
Unlock this answer now
Get Access to more Verified Answers free of charge
Correct Answer:
Verified
View Answer
Unlock this answer now
Get Access to more Verified Answers free of charge
Q212: Refer to the figure showing the recognition
Q213: A copy of the coding region of
Q214: Libraries constructed from only those genes that
Q215: Refer to the table.In this experiment researchers
Q216: Confirmation that the S gene was responsible
Q218: Refer to the figure showing an experiment
Q219: Which is not a property of yeast
Q220: Which activity would be considered cloning of
Q221: You are choosing between yeast and bacterial
Q222: Suppose a plasmid has genes that confer