Multiple Choice
The graph shows the range of variation among population members for a trait determined by multiple genes. 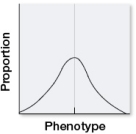 Suppose that there were no genetic component to this trait.If this population were subject to stabilizing selection for several generations, which distributions would be most likely to result? Assume that the environment stayed the same.
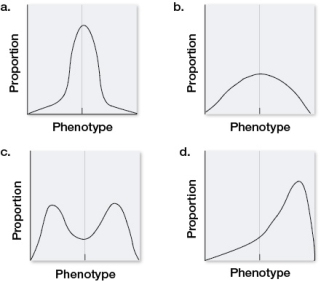
A) a
B) b
C) c
D) d
E) None of the above; there would be no change in the distribution.
Correct Answer:

Verified
Correct Answer:
Verified
Q210: Under which condition is Hardy-Weinberg equilibrium not
Q211: Male earwigs that are DD at a
Q212: Which mode(s) of selection lead(s) to a
Q213: Suppose a population of flour beetles has
Q214: Three populations of mustard plants are sampled
Q216: A population of marmots has an allele
Q217: If a change in the nucleotide, from
Q218: The numbers of fledged young of female
Q219: Suppose there are three isolated populations of
Q220: In disruptive selection,<br>A) one tail of the