Multiple Choice
The graph shows the range of variation among population members for a trait determined by multiple genes. 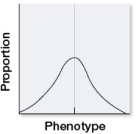 If this population were subject to stabilizing selection for several generations, which, if any, of the distributions shown would be most likely to result?
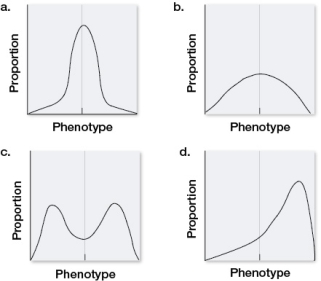
A) a
B) b
C) c
D) d
E) None of the above; there would be no change.
Correct Answer:

Verified
Correct Answer:
Verified
Q16: In Drosophila melanogaster, body size increases as
Q17: A small population of sawflies that was
Q18: Which is not a mechanism for maintaining
Q19: In a population of pitcher plants, 200
Q20: Which statement about fitness and natural selection
Q22: Yeast cells are sequenced periodically to examine
Q23: In a population of hamsters, some individuals
Q24: A normally asexual lineage experiences sexual reproduction,
Q25: Male whitetail deer produce antlers every year
Q26: Which mode(s) of selection result(s) in a