Essay
Refer to the graph showing beak size for a population of a species of Darwin's finches. 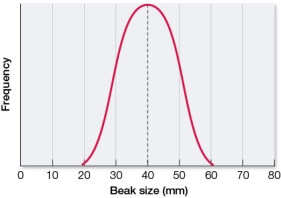 Draw a graph showing what the resulting population would most likely look like after a generation of strong disruptive selection.
Correct Answer:

Verified
Correct Answer:
Verified
Related Questions
Q46: Which statement about garter snakes that are
Q47: In a population of 200 individuals at
Q48: In a population of 600 moose, 30
Q49: Several populations of copepods are sampled for
Q50: Three different alleles (c1, c2, and c3)
Q52: An allele in a population of mockingbirds
Q53: A population of geese has an allele
Q54: Which statement about genetic drift as an
Q55: A population of swallowtail butterflies has an
Q56: In many bird species, the number of