Short Answer
The table shows the number of DNA sequence changes between different fish lineages along with the divergence time. 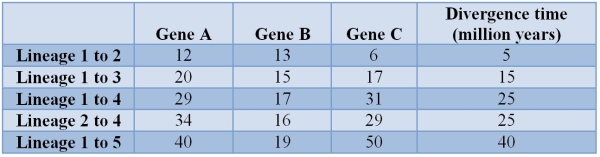 Of the three genes, gene _______ is evolving in a way closest to what would be expected under the molecular clock hypothesis.
Correct Answer:

Verified
Correct Answer:
Verified
Q23: Refer to the figure showing a single
Q24: Refer to the phylogenetic tree. <img src="https://d2lvgg3v3hfg70.cloudfront.net/TB5650/.jpg"
Q25: Traits that are similar in different species
Q26: Tomatoes are in the genus Solanum.The family
Q27: Four different phylogenetic trees of a group
Q29: The antifreeze proteins found in fish that
Q30: Suppose researchers know that two species of
Q31: Which of the following is the largest
Q32: Drosophila yakuba and D.santomea are each other's
Q33: Refer to the diagram below showing a