Multiple Choice
Refer to the graph showing variations in oxygen levels during Earth's history. 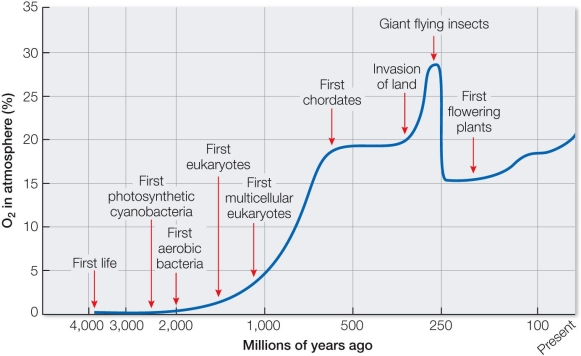 Based on the graph, what is the most logical conclusion about the abundance of plant life in the time interval about 250 million years ago?
A) Terrestrial plants went completely extinct.
B) The abundance of plant life dropped dramatically around this time.
C) Plants did not experience any major changes during this interval.
D) Plant life became much more abundant during this interval.
E) The most abundant types of plants alive at this time did not perform photosynthesis.
Correct Answer:

Verified
Correct Answer:
Verified
Q136: The study of the movement of major
Q137: The supercontinent Pangaea formed during the<br>A) Ordovician.<br>B)
Q138: The rapid climate change we are currently
Q139: Fossils<br>A) are scarce because organisms were not
Q140: During the Permian period, all of the
Q142: A pure radioactive substance has a mass
Q143: At the global level, changing environmental conditions
Q144: Refer to the figure depicting a layer
Q145: In undisturbed sedimentary rock, strata from the
Q146: Based on the results of experiments raising