Essay
Refer to the graph showing how different types of organisms respond to changes in environmental temperature. 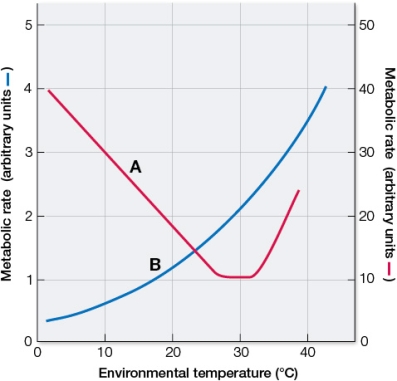 One of these curves represents a lizard, and the other represents a mouse.Which curve corresponds to which animal? At what environmental temperatures are the metabolic rates of the lizard the highest and the lowest? At what environmental temperatures are the metabolic rates of the mouse the highest and the lowest?
Correct Answer:

Verified
Curve B is for a lizard. The highest met...View Answer
Unlock this answer now
Get Access to more Verified Answers free of charge
Correct Answer:
Verified
View Answer
Unlock this answer now
Get Access to more Verified Answers free of charge
Q75: Which is an adaptation used by endotherms,
Q76: Which statement is correct?<br>A) The thermoneutral zone
Q77: Which statement about endotherms is true?<br>A) They
Q78: A lizard lives in a temperate desert
Q79: Acclimatization<br>A) is evolutionary change.<br>B) is the physiological
Q81: During the day, hummingbirds maintain a high,
Q82: Evaporative cooling is used only as a
Q83: A moth prior to taking flight can
Q84: Which statement is correct?<br>A) Many insects produce
Q85: Refer to the figure. <img src="https://d2lvgg3v3hfg70.cloudfront.net/TB5650/.jpg" alt="Refer