Essay
Refer to the graph showing body temperature and heart rate in the Galápagos marine iguana as it moves from feeding in the ocean to basking on hot rocks on shore. 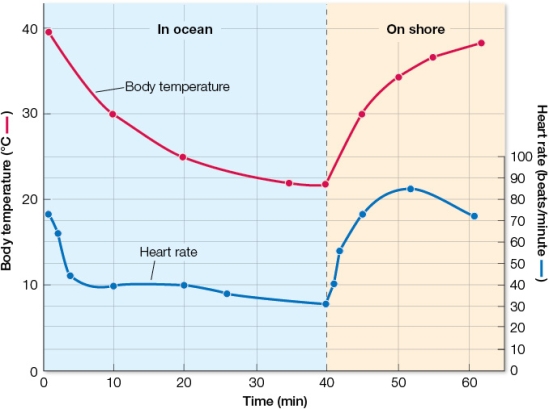 What is the heart rate of the iguana when its body temperature is 30°C in the ocean and when it is 30°C after coming out on land? How could this change in heart rate be related to the rate of warming of the iguana's body when moving from the water to land?
Correct Answer:

Verified
When the iguana's body temperature is 30...View Answer
Unlock this answer now
Get Access to more Verified Answers free of charge
Correct Answer:
Verified
View Answer
Unlock this answer now
Get Access to more Verified Answers free of charge
Q122: Which statement about muscle tissue is false?<br>A)
Q123: Refer to the graph. <img src="https://d2lvgg3v3hfg70.cloudfront.net/TB5650/.jpg" alt="Refer
Q124: Refer to the graph showing body temperature
Q125: Homeostasis refers to the tendency<br>A) to keep
Q126: A high school cross-country runner ignores her
Q128: You are working in a lab and
Q129: Red-tailed hawks drop their body temperature at
Q130: Researchers have found that king penguin chicks
Q131: In humans, prolactin is involved in the
Q132: At the end of the summer you