Multiple Choice
Refer to the graph.In this experiment, the same fish were caught and brought into the lab in both winter and summer.Their metabolic rates (O2 consumption) were measured at the pond temperatures for each season () and at other temperatures () . 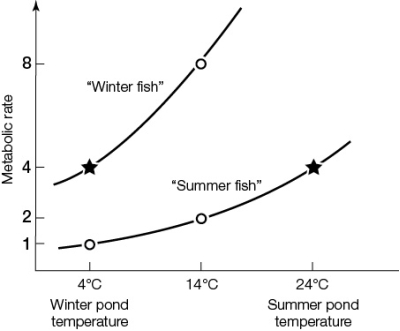 This experiment demonstrates the phenomenon of
A) homeostasis.
B) acclimatization.
C) declimatization.
D) negative feedback.
E) positive feedback.
Correct Answer:

Verified
Correct Answer:
Verified
Q13: If an animal is kept in an
Q14: Daily torpor is<br>A) found in small endotherms.<br>B)
Q15: In the countercurrent heat exchanger of a
Q16: In terms of the predominant source of
Q17: Hibernation is<br>A) thought to have evolved as
Q19: Which statement is true?<br>A) At temperatures below
Q20: Smooth muscle<br>A) attaches to bones.<br>B) is part
Q21: Which animal is behaving as an endotherm
Q22: A squirrel that metabolically maintains its internal
Q23: Which characteristic pertains to brown fat?<br>A) Its