Multiple Choice
Refer to the graph showing body temperature and heart rate in the Galápagos marine iguana as it moves from feeding in the ocean to basking on hot rocks on shore. 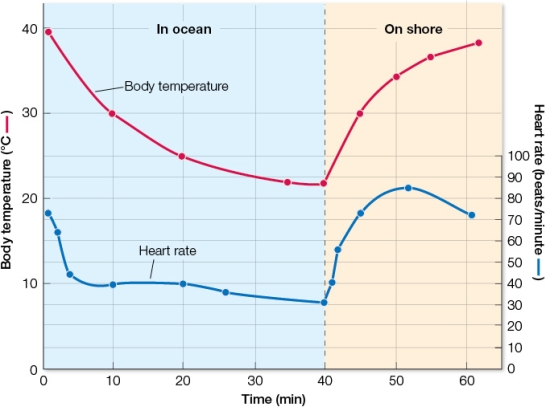 From this graph, a logical conclusion about the iguana is that
A) its heart rate is not regulated entirely by body temperature.
B) the maximum body temperature it achieves when on shore is 38°C.
C) its heart rate drops quickly in the cold ocean and rises more slowly on warm land.
D) the lowest heart rate the animal tolerates before coming back on land is approximately 7-8 beats per minute.
E) at comparable body temperatures, its heart rate is higher during cooling than warming.
Correct Answer:

Verified
Correct Answer:
Verified
Q245: The list below shows possible metabolic responses
Q246: Refer to the graph showing body temperature
Q247: Which statement is correct?<br>A) Endotherms' body temperatures
Q248: Which is the best description of the
Q249: _ are cells of the nervous system
Q251: When an ectotherm and an endotherm of
Q252: Which statement about tissues is true?<br>A) Collagen
Q253: The list below shows possible metabolic responses
Q254: To calculate the sensitivity of a physiological
Q255: Behavioral thermoregulation<br>A) occurs only in ectotherms.<br>B) allows