Multiple Choice
Refer to the graph. 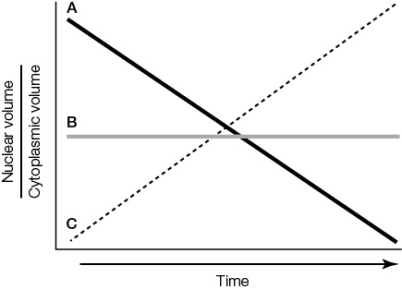 In the graph, curve _______ best represents the changes in the ratio of nuclear volume to cytoplasmic volume during early cleavage in most animals.At this time, the blastomeres _______ in size.
A) A; decrease
B) B; decrease
C) C; decrease
D) A; increase
E) C; increase
Correct Answer:

Verified
Correct Answer:
Verified
Q96: Which feature characterizes the sea urchin archenteron?<br>A)
Q97: In vertebrates, the initiation of the nervous
Q98: Which statement about gastrulation in amphibians is
Q99: Which statement about chick development is true?<br>A)
Q100: A man and a woman who are
Q102: An obstetrician can listen to the heartbeat
Q103: Which statement about developing placental mammals is
Q104: The gray crescent in a frog zygote<br>A)
Q105: Refer to the figure showing a stage
Q106: Which structure in birds and mammals is