Multiple Choice
Refer to the graph representing the WilsonMacArthur theory of island biogeography, which explains the speciesarea relationship. 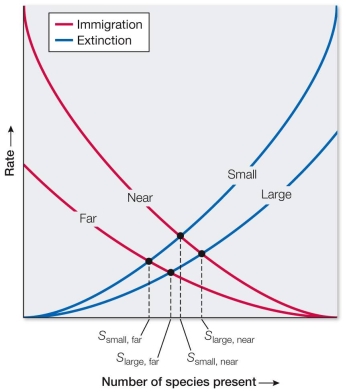 According to the graph, the number of species on an island reaches equilibrium when
A) immigration and extinction rates are zero.
B) immigration and extinction rates are equal.
C) immigration rates rise faster than extinction rates.
D) extinction rates rise faster than immigration rates.
E) islands are large and near continents, regardless of rates.
Correct Answer:

Verified
Correct Answer:
Verified
Q213: Giant seaweeds, or kelps, live in shallow,
Q214: Describe how greenhouse gases act to maintain
Q215: A group of scientists wants to design
Q216: Thomas Lovejoy and colleagues conducted a long-term
Q217: There are approximately 40,000 species of trees
Q219: A once-common species of butterfly has disappeared
Q220: Urban landscapes are known to produce "heat
Q221: In Europe the major mountain ranges run
Q222: A hummingbird conservation group wants to find
Q223: Refer to the diagram below. <img src="https://d2lvgg3v3hfg70.cloudfront.net/TB5650/.jpg"