Multiple Choice
Refer to the graph below. 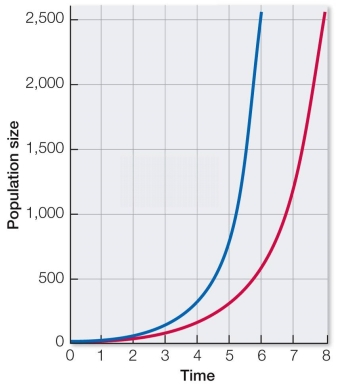 In the graph shown, what factor causes the difference in placement between the left and right growth curves?
A) The left curve has a greater per capita growth rate, or r.
B) The right curve has a greater per capita growth rate, or r.
C) The left curve has a larger starting population, or N0.
D) The right curve has a larger starting population, or N0.
E) The left curve changes by a constant number, the right by a constant proportion.
Correct Answer:

Verified
Correct Answer:
Verified
Q52: Ecologists measure population characteristics over several years
Q53: In studying a tiny nematode worm, scientists
Q54: Compared to K-strategists, r-strategists are more adapted
Q55: Two populations are growing exponentially.At the end
Q56: North Pacific humpback whale populations declined dramatically
Q58: The starting size of Population A is
Q59: In the early twentieth century, a plant
Q60: Mountain sheep in Southern California are separated
Q61: Due to the difficulty of following their
Q62: Both schools of sardines and flocks of