Multiple Choice
In the graph below, which of the expressions of the exponential growth equation would need to be increased for curve 1 to become more like curve 2? 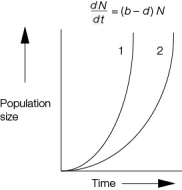
A) dN/dt
B) b
C) d
D) (b - d)
E) N
Correct Answer:

Verified
Correct Answer:
Verified
Related Questions
Q89: A gardener decides to estimate the population
Q90: People concerned with calculating Social Security benefits
Q91: Most humans live close together in cities,
Q92: Regarding its carrying capacity, a well-managed fish
Q93: In a life table, the proportion of
Q95: The mark-recapture method of estimating population size
Q96: Refer to the table below, which shows
Q97: A population following a logistic growth pattern<br>A)
Q98: The average life span of the human
Q99: Refer to the figure comparing exponential and