Multiple Choice
The graph below shows cycles of predators (lynx) and prey (snowshoe hares) over nearly a century.During this time, people were trapping both lynx and hares, thus limiting their populations. 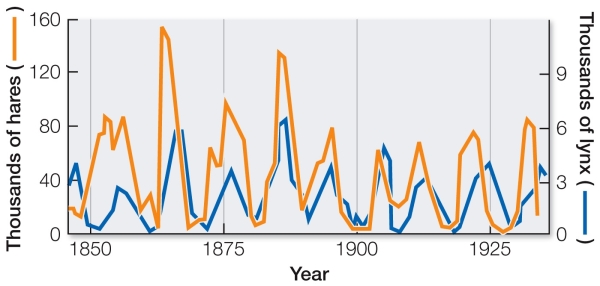 If trapping of both species declined, what changes would be expected to occur in the hare and lynx populations?
A) Cycles would continue but probably at higher levels.
B) Cycles would continue but probably at lower levels.
C) Both hare and lynx populations would increase, and cycles would stop.
D) Both hare and lynx populations would decrease, and cycles would stop.
E) Both hare and lynx populations would increase to their carrying capacities and level off.
Correct Answer:

Verified
Correct Answer:
Verified
Q119: The relationship between flowering plants and the
Q120: Nitrogen is absorbed by plants through their
Q121: Evidence suggests that some grasses benefit from
Q122: Various types of aphids feed on the
Q123: Which feature of a fruit would be
Q125: A stressful environment, such as a desert,
Q126: Many stinging wasps that are not closely
Q127: Which type of interaction best characterizes a
Q128: Which type of study would likely provide
Q129: An "honest" mimic that is genuinely unpalatable