Multiple Choice
Refer to the graph, showing a continual increase in CO2 since measurements began about 1960. 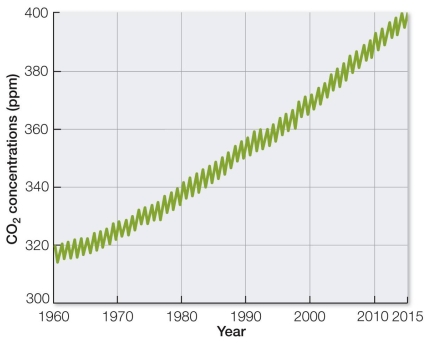 Which type of data, when added to the data in this graph, would not provide evidence of a connection between rising CO2 levels and rising global temperatures?
A) Atmospheric temperatures over thousands of years
B) Atmospheric temperatures since 1960
C) A climate model correlating rising temperatures with rising CO2
D) Chemistry experiment results showing that CO2 traps heat
E) Measurements showing CO2 being dissolved in the oceans
Correct Answer:

Verified
Correct Answer:
Verified
Q11: Refer to the map. <img src="https://d2lvgg3v3hfg70.cloudfront.net/TB5650/.jpg" alt="Refer
Q12: A single pitcher plant is defined as
Q13: An animal dies near the forest edge.Almost
Q14: Which ecosystem would have the highest trophic
Q15: Refer to the figure. <img src="https://d2lvgg3v3hfg70.cloudfront.net/TB5650/.jpg" alt="Refer
Q17: In a region of the open ocean,
Q18: Refer to the figure. <img src="https://d2lvgg3v3hfg70.cloudfront.net/TB5650/.jpg" alt="Refer
Q19: All of the biomass in an ecosystem
Q20: Refer to figure. <img src="https://d2lvgg3v3hfg70.cloudfront.net/TB5650/.jpg" alt="Refer to
Q21: Trophic efficiency in an ecosystem can be