Essay
Refer to the graph. 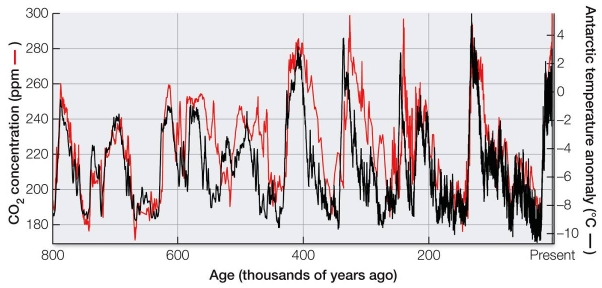 The graph shows both atmospheric CO2 concentration and Antarctic atmospheric temperature anomaly over the past 800,000 years.Discuss the significance of the correlation between these two factors.How do they relate to climate change today?
Correct Answer:

Verified
The graph shows that over the past 800,0...View Answer
Unlock this answer now
Get Access to more Verified Answers free of charge
Correct Answer:
Verified
View Answer
Unlock this answer now
Get Access to more Verified Answers free of charge
Q216: Refer to the figure. <img src="https://d2lvgg3v3hfg70.cloudfront.net/TB5650/.jpg" alt="Refer
Q217: Primary producers in an ecosystem obtain their
Q218: The whole lake fertilization experiments conducted by
Q219: The average NPP value for a region
Q220: Rising global temperatures increase the rate of
Q222: Energy from the sun controls the hydrologic
Q223: About 90 percent of the water in
Q224: According to the second law of thermodynamics,
Q225: Compared with the open ocean ecosystem, the
Q226: Primary consumers on land consume an average