Multiple Choice
Refer to the graph, showing a continual increase in CO2 since measurements began about 1960. 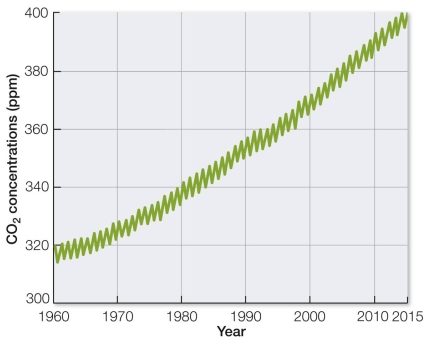 In addition to the data plotted in the graph, data from air trapped in ice caps show that CO2 levels have been strongly correlated with atmospheric temperatures for hundreds of thousands of years.What is one conclusion that might be drawn from these two sets of data?
A) Adding CO2 to the atmosphere is raising global temperatures.
B) Adding CO2 to the atmosphere is lowering global temperatures.
C) CO2 levels can be controlled by stopping CO2 measurements.
D) CO2 levels can be controlled by controlling global temperatures.
E) The most likely way to control CO2 is by controlling rates of photosynthesis.
Correct Answer:

Verified
Correct Answer:
Verified
Q173: In much of the open ocean, NPP
Q174: In which situation would bacteria be most
Q175: The proportion of the total available biomass
Q176: Refer to the figure. <img src="https://d2lvgg3v3hfg70.cloudfront.net/TB5650/.jpg" alt="Refer
Q177: Of the following food webs, which would
Q179: Phytoplankton growth in surface water samples from
Q180: The ecosystem type responsible for by far
Q181: A desert environment has a very low
Q182: The flesh of a dead animal is
Q183: Refer to the figure. <img src="https://d2lvgg3v3hfg70.cloudfront.net/TB5650/.jpg" alt="Refer