Multiple Choice
Refer to the graph, showing changes in atmospheric CO2 concentrations in the Northern Hemisphere from 1960 to 2015. 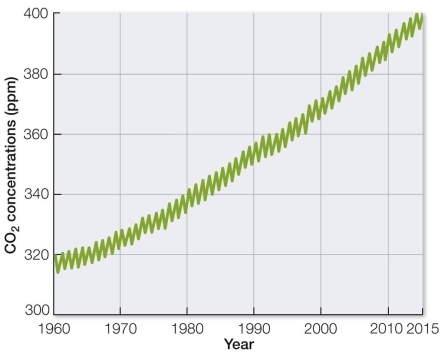 The data indicate that the overall CO2 concentration is _______, with yearly fluctuations due to _______.
A) variable; precipitation
B) increasing; ocean absorption
C) increasing; photosynthesis
D) decreasing; precipitation
E) decreasing; photosynthesis
Correct Answer:

Verified
Correct Answer:
Verified
Q154: Without microbes (primarily bacteria), what would most
Q155: The wolves in Yellowstone National Park exert
Q156: Cities in China are greatly increasing the
Q157: Which of these situations does not involve
Q158: Steller sea lion populations in Alaska declined
Q160: For most of human history, we have
Q161: Hydrothermal vent communities on the ocean floor
Q162: In the past two centuries, humans have
Q163: Scientists measured plankton production in an estuary
Q164: As people around the world remove water