True/False
Figure 2-14 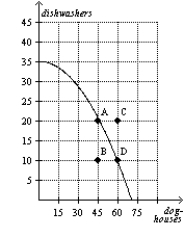
-Refer to Figure 2-14.Points B and C represent infeasible outcomes for this economy.
Correct Answer:

Verified
Correct Answer:
Verified
Related Questions
Q6: In the circular-flow diagram, firms own the
Q23: According to John Maynard Keynes, an economist
Q41: The production possibilities frontier is a graph
Q99: All scientific models, including economic models, simplify
Q120: Figure 2-17 <img src="https://d2lvgg3v3hfg70.cloudfront.net/TB2297/.jpg" alt="Figure 2-17
Q121: Economists believe that production possibilities frontiers rarely
Q132: Points on the production possibilities frontier represent
Q133: It is difficult for economists to make
Q156: Examples of graphs of a single variable
Q261: In the circular-flow diagram, one loop represents