Multiple Choice
Figure 9-14.On the diagram below,Q represents the quantity of crude oil and P represents the price of crude oil. 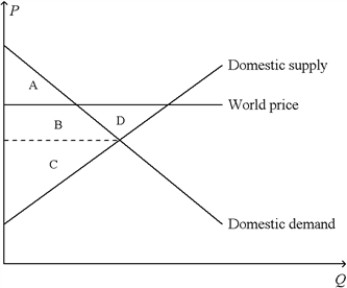
-Refer to Figure 9-14.When the country for which the figure is drawn allows international trade in crude oil,
A) consumer surplus changes from the area A + B + D to the area A.
B) producer surplus changes from the area C to the area B + C + D.
C) total surplus decreases by the area D.
D) All of the above are correct.
Correct Answer:

Verified
Correct Answer:
Verified
Q78: Scenario 9-2<br>• For a small country called
Q79: Domestic producers of a good become worse
Q80: The nation of Aquilonia has decided to
Q81: Import quotas and tariffs produce some common
Q82: Figure 9-15 <img src="https://d2lvgg3v3hfg70.cloudfront.net/TB2297/.jpg" alt="Figure 9-15
Q84: When a nation first begins to trade
Q85: Figure 9-22<br>The following diagram shows the domestic
Q86: Figure 9-6<br>The figure illustrates the market for
Q87: Figure 9-1<br>The figure illustrates the market for
Q88: An import quota<br>A)is preferable to a tariff