Multiple Choice
Figure 9-18.On the diagram below,Q represents the quantity of peaches and P represents the price of peaches.The domestic country is Isoland. 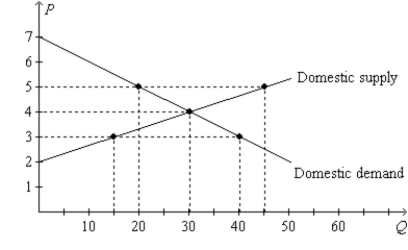
-Refer to Figure 9-18.Suppose Isoland changes from a no-trade policy to a policy that allows international trade.If the world price of peaches is $5,then the policy change results in
A) a decrease in consumer surplus.
B) an increase in producer surplus.
C) an increase in total surplus.
D) All of the above are correct.
Correct Answer:

Verified
Correct Answer:
Verified
Q205: Figure 9-22<br>The following diagram shows the domestic
Q206: Chile is an importer of computer chips,taking
Q207: Figure 9-2<br>The figure illustrates the market for
Q208: Figure 9-23<br>The following diagram shows the domestic
Q209: Suppose a certain country imposes a tariff
Q211: Figure 9-18.On the diagram below,Q represents the
Q212: Both tariffs and import quotas<br>A)increase the quantity
Q213: Figure 9-20<br>The figure illustrates the market for
Q214: Figure 9-5<br>The figure illustrates the market for
Q215: Figure 9-17 <img src="https://d2lvgg3v3hfg70.cloudfront.net/TB2297/.jpg" alt="Figure 9-17