Multiple Choice
Figure 9-18.On the diagram below,Q represents the quantity of peaches and P represents the price of peaches.The domestic country is Isoland. 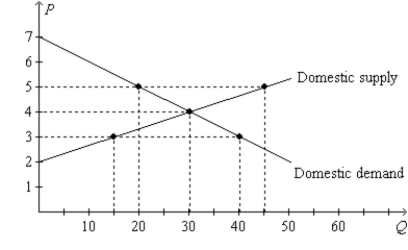
-Refer to Figure 9-18.Suppose Isoland changes from a no-trade policy to a policy that allows international trade.If the world price of peaches is $5,then the policy change results in a
A) $25 decrease in consumer surplus.
B) $20 increase in consumer surplus.
C) $25 decrease in producer surplus.
D) $20 increase in producer surplus.
Correct Answer:

Verified
Correct Answer:
Verified
Q21: When the nation of Worldova allows trade
Q54: Suppose Iceland goes from being an isolated
Q55: If Freedonia changes its laws to allow
Q57: After a certain nation changed its policy
Q58: When a country allows trade and becomes
Q60: Figure 9-11 <img src="https://d2lvgg3v3hfg70.cloudfront.net/TB2297/.jpg" alt="Figure 9-11
Q61: For a country that is considering the
Q62: Figure 9-15 <img src="https://d2lvgg3v3hfg70.cloudfront.net/TB2297/.jpg" alt="Figure 9-15
Q63: Figure 9-26<br>The diagram below illustrates the market
Q64: When a country allows international trade and