Multiple Choice
Figure 9-25
The following diagram shows the domestic demand and supply in a market.Assume that the world price in this market is $10 per unit. 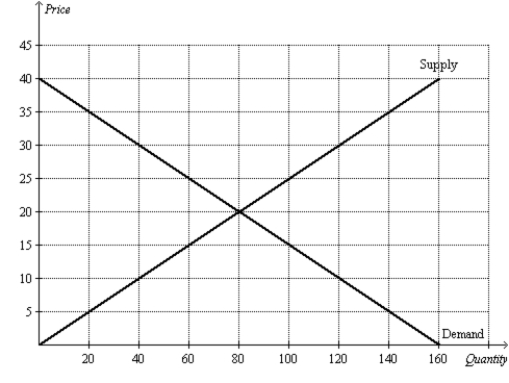
-Refer to Figure 9-25.Suppose the government imposes a tariff of $5 per unit.The deadweight loss caused by the tariff is
A) $25.
B) $50.
C) $75.
D) $100.
Correct Answer:

Verified
Correct Answer:
Verified
Q57: When the nation of Duxembourg allows trade
Q244: Figure 9-10.The figure applies to Mexico and
Q245: A major difference between tariffs and import
Q246: Figure 9-16.The figure below illustrates a tariff.On
Q247: Some goods can be produced at low
Q250: Trade raises the economic well-being of a
Q251: Figure 9-7.The figure applies to the nation
Q252: Spain is an importer of computer chips,taking
Q253: Figure 9-10.The figure applies to Mexico and
Q254: Which of the following statements is true?<br>A)Free