Multiple Choice
Figure 8-6
The vertical distance between points A and B represents a tax in the market. 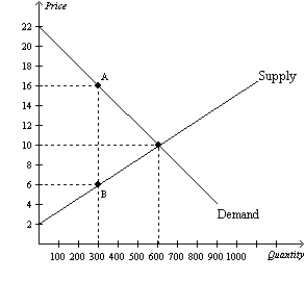
-Refer to Figure 8-6.What happens to total surplus in this market when the tax is imposed?
A) Total surplus increases by $1,500.
B) Total surplus increases by $3,000.
C) Total surplus decreases by $1,500.
D) Total surplus decreases by $,3000.
Correct Answer:

Verified
Correct Answer:
Verified
Q84: Figure 8-1 <img src="https://d2lvgg3v3hfg70.cloudfront.net/TB7555/.jpg" alt="Figure 8-1
Q160: Figure 8-2<br>The vertical distance between points A
Q161: If a tax shifts the supply curve
Q162: Suppose a tax of $3 per unit
Q163: Figure 8-4<br>The vertical distance between points A
Q164: For widgets,the supply curve is the typical
Q167: Figure 8-12 <img src="https://d2lvgg3v3hfg70.cloudfront.net/TB2297/.jpg" alt="Figure 8-12
Q168: Figure 8-7<br>The vertical distance between points A
Q169: Figure 8-9<br>The vertical distance between points A
Q170: Figure 8-10 <img src="https://d2lvgg3v3hfg70.cloudfront.net/TB2297/.jpg" alt="Figure 8-10