Multiple Choice
Figure 8-9
The vertical distance between points A and C represents a tax in the market. 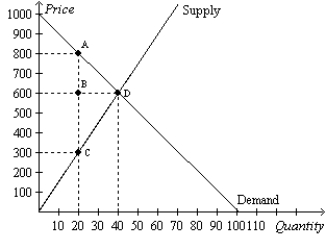
-Refer to Figure 8-9.The imposition of the tax causes the quantity sold to
A) increase by 20 units.
B) increase by 500 units.
C) decrease by 20 units.
D) decrease by 500 units.
Correct Answer:

Verified
Correct Answer:
Verified
Q71: When a tax on a good is
Q72: Figure 8-9<br>The vertical distance between points A
Q73: Figure 8-6<br>The vertical distance between points A
Q74: Figure 8-11 <img src="https://d2lvgg3v3hfg70.cloudfront.net/TB2297/.jpg" alt="Figure 8-11
Q75: Figure 8-3<br>The vertical distance between points A
Q77: A tax levied on the sellers of
Q78: Figure 8-11 <img src="https://d2lvgg3v3hfg70.cloudfront.net/TB2297/.jpg" alt="Figure 8-11
Q79: Figure 8-8<br>Suppose the government imposes a $10
Q80: The supply curve for whiskey is the
Q81: Deadweight loss is the<br>A)decline in total surplus