Multiple Choice
Figure 7-10 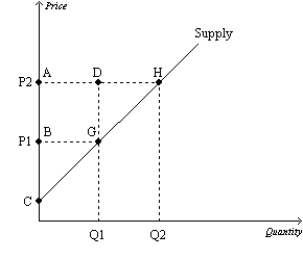
-Refer to Figure 7-10.Which area represents the increase in producer surplus when the price rises from P1 to P2?
A) BCG
B) ACH
C) ABGD
D) AHGB
Correct Answer:

Verified
Correct Answer:
Verified
Q24: Figure 7-17 <img src="https://d2lvgg3v3hfg70.cloudfront.net/TB2297/.jpg" alt="Figure 7-17
Q25: Figure 7-15 <img src="https://d2lvgg3v3hfg70.cloudfront.net/TB2297/.jpg" alt="Figure 7-15
Q26: If Martin sells a shirt for $40,and
Q27: At Nick's Bakery,the cost to make a
Q28: Figure 7-16 <img src="https://d2lvgg3v3hfg70.cloudfront.net/TB2297/.jpg" alt="Figure 7-16
Q30: Suppose the demand for peanuts increases.What will
Q31: Figure 7-16 <img src="https://d2lvgg3v3hfg70.cloudfront.net/TB2297/.jpg" alt="Figure 7-16
Q32: If the demand for light bulbs increases,producer
Q33: Figure 7-16 <img src="https://d2lvgg3v3hfg70.cloudfront.net/TB2297/.jpg" alt="Figure 7-16
Q34: Figure 7-10 <img src="https://d2lvgg3v3hfg70.cloudfront.net/TB2297/.jpg" alt="Figure 7-10