Multiple Choice
Figure 7-10 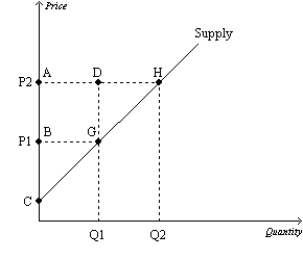
-Refer to Figure 7-10.Which area represents the increase in producer surplus when the price rises from P1 to P2 due to new producers entering the market?
A) BCG
B) ACH
C) DGH
D) AHGB
Correct Answer:

Verified
Correct Answer:
Verified
Q58: Figure 7-17 <img src="https://d2lvgg3v3hfg70.cloudfront.net/TB2297/.jpg" alt="Figure 7-17
Q59: A seller is willing to sell a
Q60: Producer surplus directly measures<br>A)the well-being of society
Q60: Figure 7-15 <img src="https://d2lvgg3v3hfg70.cloudfront.net/TB2297/.jpg" alt="Figure 7-15
Q61: Producer surplus is the<br>A)area under the supply
Q64: Figure 7-16 <img src="https://d2lvgg3v3hfg70.cloudfront.net/TB2297/.jpg" alt="Figure 7-16
Q65: Figure 7-9 <img src="https://d2lvgg3v3hfg70.cloudfront.net/TB2297/.jpg" alt="Figure 7-9
Q66: Figure 7-9 <img src="https://d2lvgg3v3hfg70.cloudfront.net/TB2297/.jpg" alt="Figure 7-9
Q67: Figure 7-15 <img src="https://d2lvgg3v3hfg70.cloudfront.net/TB2297/.jpg" alt="Figure 7-15
Q86: A supply curve can be used to