Multiple Choice
Figure 6-5 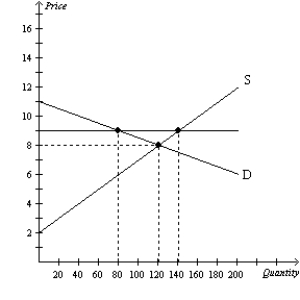
-Refer to Figure 6-5.If the solid horizontal line on the graph represents a price ceiling,then the price ceiling is
A) binding and creates a surplus of 60 units of the good.
B) binding and creates a surplus of 20 units of the good.
C) not binding but creates a surplus of 40 units of the good.
D) not binding,and there will be no surplus or shortage of the good.
Correct Answer:

Verified
Correct Answer:
Verified
Q187: Long lines<br>A)and discrimination according to seller bias
Q188: After OPEC raised the price of crude
Q189: Figure 6-7 <img src="https://d2lvgg3v3hfg70.cloudfront.net/TB2297/.jpg" alt="Figure 6-7
Q190: Which of the following observations would be
Q191: The proportion of minimum-wage earners who are
Q193: When a binding price ceiling is imposed
Q194: A shortage results when a<br>A)nonbinding price ceiling
Q195: Figure 6-13<br>This figure shows the market demand
Q196: Figure 6-6 <img src="https://d2lvgg3v3hfg70.cloudfront.net/TB2297/.jpg" alt="Figure 6-6
Q197: The minimum wage is an example of