Multiple Choice
Figure 5-14 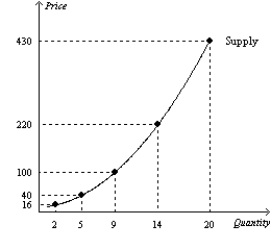
-Refer to Figure 5-14.Over which range is the supply curve in this figure the least elastic?
A) $16 to $40
B) $40 to $100
C) $100 to $220
D) $220 to $430
Correct Answer:

Verified
Correct Answer:
Verified
Related Questions
Q63: Suppose the price elasticity of supply for
Q64: Suppose that two supply curves pass through
Q65: Figure 5-15 <img src="https://d2lvgg3v3hfg70.cloudfront.net/TB2297/.jpg" alt="Figure 5-15
Q66: If the price elasticity of supply for
Q68: The price elasticity of supply along a
Q69: Figure 5-15 <img src="https://d2lvgg3v3hfg70.cloudfront.net/TB2297/.jpg" alt="Figure 5-15
Q70: A manufacturer produces 400 units when the
Q71: At price of $1.30 per pound,a local
Q72: A bakery would be willing to supply
Q159: The price elasticity of supply measures how