Multiple Choice
Figure 5-4 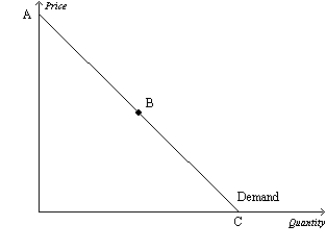
-Refer to Figure 5-4.Assume the section of the demand curve from A to B corresponds to prices between $6 and $12.Then,when the price increases from $8 to $10,
A) the percent decrease in the quantity demanded exceeds the percent increase in the price.
B) the percent increase in the price exceeds the percent decrease in the quantity demanded.
C) sellers' total revenue increases as a result.
D) it is possible that the quantity demanded fell from 550 to 500 as a result.
Correct Answer:

Verified
Correct Answer:
Verified
Q1: Suppose that quantity demand rises by 10%
Q4: Suppose the price of a bag of
Q5: Other things equal,the demand for a good
Q6: Figure 5-3 <img src="https://d2lvgg3v3hfg70.cloudfront.net/TB2297/.jpg" alt="Figure 5-3
Q7: Scenario 5-1<br>Suppose that when the average college
Q8: To determine whether a good is considered
Q9: If the price elasticity of demand for
Q11: While in college,Marty and Laura each buy
Q48: Demand is said to be inelastic if<br>A)buyers
Q78: Skip's Sealcoating Service increased its total monthly