Multiple Choice
Figure 5-4 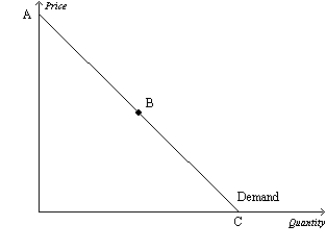
-Refer to Figure 5-4.If the price decreases in the region of the demand curve between points A and B,we can expect total revenue to
A) increase.
B) stay the same.
C) decrease.
D) first decrease,then increase until total revenue is maximized.
Correct Answer:

Verified
Correct Answer:
Verified
Q87: When quantity moves proportionately the same amount
Q88: Suppose good X has a negative income
Q89: Which of the following is likely to
Q90: Figure 5-9 <img src="https://d2lvgg3v3hfg70.cloudfront.net/TB2297/.jpg" alt="Figure 5-9
Q91: Figure 5-7 <img src="https://d2lvgg3v3hfg70.cloudfront.net/TB2297/.jpg" alt="Figure 5-7
Q93: When the price of candy bars is
Q94: If the price elasticity of demand for
Q95: Figure 5-1 <img src="https://d2lvgg3v3hfg70.cloudfront.net/TB2297/.jpg" alt="Figure 5-1
Q96: Figure 5-4 <img src="https://d2lvgg3v3hfg70.cloudfront.net/TB2297/.jpg" alt="Figure 5-4
Q97: If the price elasticity of demand for