Multiple Choice
Figure 5-4 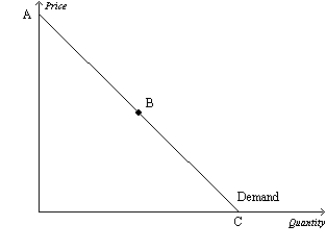
-Refer to Figure 5-4.If the price increases in the region of the demand curve between points B and C,we can expect total revenue to
A) increase.
B) stay the same.
C) decrease.
D) first decrease,then increase until total revenue is maximized.
Correct Answer:

Verified
Correct Answer:
Verified
Q80: Income elasticity of demand measures how<br>A)the quantity
Q231: You and your college roommate eat three
Q232: Whether a good is a luxury or
Q233: Figure 5-11 <img src="https://d2lvgg3v3hfg70.cloudfront.net/TB2297/.jpg" alt="Figure 5-11
Q234: Suppose good X has a positive income
Q235: The price elasticity of demand for bread<br>A)is
Q237: For a particular good,a 5 percent increase
Q238: Suppose the cross-price elasticity of demand between
Q239: Figure 5-5 <img src="https://d2lvgg3v3hfg70.cloudfront.net/TB2297/.jpg" alt="Figure 5-5
Q240: When her income increased from $10,000 to