Multiple Choice
Figure 5-9 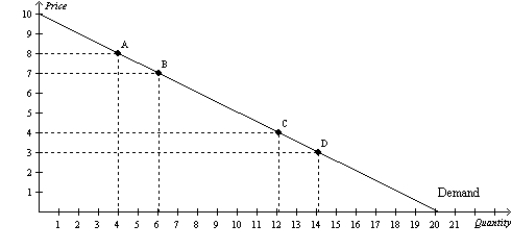
-Refer to Figure 5-9.Using the midpoint method,the price elasticity of demand between point A and point B is
A) 0.33.
B) 0.5.
C) 2.0.
D) 3.0.
Correct Answer:

Verified
Correct Answer:
Verified
Q22: When quantity demanded responds strongly to changes
Q23: Figure 5-10 <img src="https://d2lvgg3v3hfg70.cloudfront.net/TB2297/.jpg" alt="Figure 5-10
Q24: Scenario 5-1<br>Suppose that when the average college
Q25: Holding all other forces constant,if decreasing the
Q26: Figure 5-12 <img src="https://d2lvgg3v3hfg70.cloudfront.net/TB2297/.jpg" alt="Figure 5-12
Q28: Figure 5-9 <img src="https://d2lvgg3v3hfg70.cloudfront.net/TB2297/.jpg" alt="Figure 5-9
Q29: Which of the following expressions can be
Q30: Figure 5-6 <img src="https://d2lvgg3v3hfg70.cloudfront.net/TB2297/.jpg" alt="Figure 5-6
Q31: Total revenue will be at its largest
Q32: Which of the following could be the